Activity: The Height Prediction Game - A Linear Regression Adventure
Objective:
Learn about Linear Regression by predicting the height of a tree as it grows!
Materials:
A large piece of paper or poster board.
Ruler or measuring tape.
Markers or colored pencils.
Stickers or small cut-out leaves.
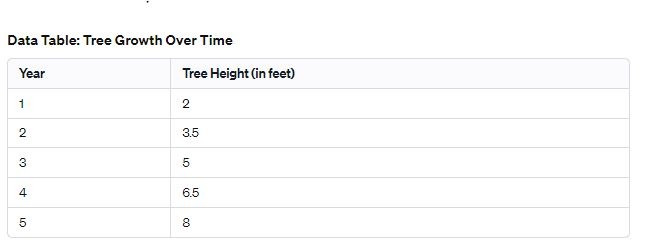
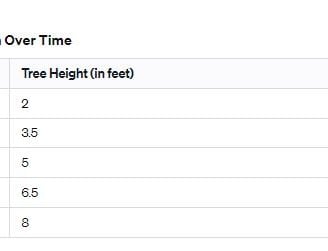
Data Table of Tree Growth (provided below).


Instructions:
Create Your Growth Chart:
Draw a big tree on your poster board.
Use the ruler to make a vertical line next to the tree, like a giant ruler. Mark feet from 1 to 10.
Plot the Data:
Look at the Data Table of Tree Growth.
For each year, place a sticker or a leaf cut-out at the height the tree reached that year. For example, in Year 1, put a sticker at 2 feet on your growth chart.
Connect the Dots:
Draw a line connecting all the stickers or leaves. This line shows how the tree grew over the years.
Predict the Future:
Now, guess how tall the tree will be in Year 9 and Year 10. Place a different colored sticker or leaf where you think it will be.
Use the pattern of the line you drew to help you guess. This is like using Linear Regression to predict the future!
Discussion:
Talk about your predictions. Why did you choose those heights for Year 9 and Year 10?
Explain that in Linear Regression, a computer would use a similar method to make predictions based on past data.
Extra Challenge:
Can you predict how tall the tree will be in Year 12? What about Year 18?
Discuss how your predictions might change the further away you get from the data you have.
Reflection:
Think about other things that grow or change over time. How could you use a chart like this to make predictions about them?
Educational Value:
This activity introduces the concept of Linear Regression in a fun and interactive way. It helps kids understand how patterns in data can be used to make predictions about the future, a fundamental concept in machine learning and AI.